

Self-check
What the self-check catches before you deploy — configuration validation and the runnable checks, the kinds each node offers, who runs them, the states you see, and how the Issues gate blocks errors and lets you override warnings.
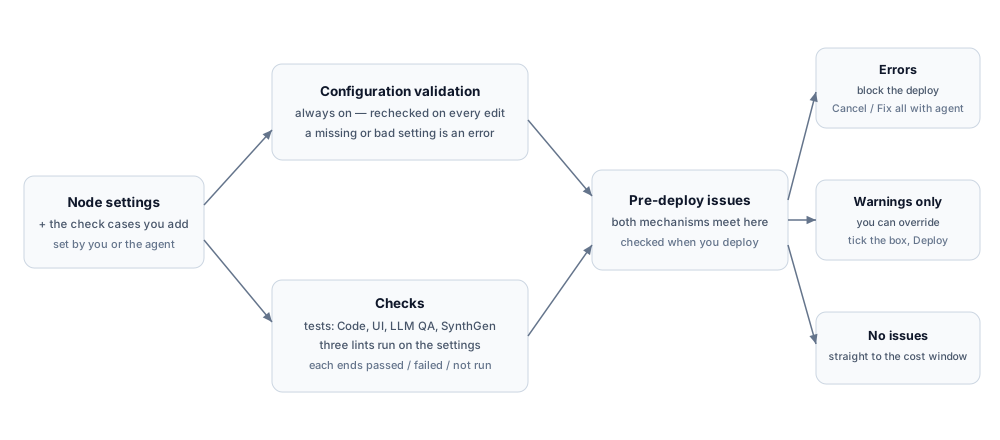
Before you deploy a pipeline, the platform checks that it is built correctly, while fixing anything wrong is still free. Self-check is this page’s collective name for that gate — the product has no screen with that label. It combines two things: an always-on look at whether every node is configured, and a set of checks you can run to exercise each node on sample values. Together they decide whether the pipeline can deploy.
In the product, the self-check shows up as the check cards on each node and, when you go to deploy, the Issues window.
Configuration validation and checks
Section titled “Configuration validation and checks”Two mechanisms feed the self-check, and they behave differently.
Configuration validation is always on. Each time you or the agent change a node, the platform rechecks its settings and flags anything missing or malformed, such as an empty Code node or a missing or badly formatted node name. These are errors, and they last until the setting is fixed.
Checks are runs you start. Each check belongs to one node and holds a result: it starts not run, and running it leaves it passed or failed. A check runs only when you or the agent run it. It does not run on save, on a schedule, or at deploy.
The two come together at deploy. The platform gathers the current validation and the state of every check into one report, the Issues window, and that report decides what happens next.
The kinds of check
Section titled “The kinds of check”Seven kinds of check exist, in two families. Test checks hold cases you author — a case is a sample input you name and fill in yourself — and you decide whether to run them. Lint checks always exist on their node, take no case, and must finish before the deploy is allowed.
| Test check | On which nodes | What running it does | Who can run it |
|---|---|---|---|
| Code Test | Code node | Runs your Python once on the case’s sample inputs, with the node’s real environment variables and secrets | The agent or you |
| User Interface | Generation, Quorum | Renders the real labeling screen with the check’s own sample pre-filled. A person completes and submits it | You only. The agent cannot run it |
| LLM Quality Assurance | Generation, Quorum | Runs the node’s LLM review on a sample output and returns a verdict per quality criterion (one per expert on a Quorum node) | The agent or you |
| Synthetic Generation Test | Generation, under synthetic labeling | Generates one sample output with the node’s model and settings, and reports the input, cached, and output tokens it used | The agent or you |
| Lint check | On which nodes | What it reports |
|---|---|---|
| Quality Requirements | Generation, Quorum | An LLM critique of how your quality criteria are configured: contradictions with the instruction, overlaps, checks the task cannot support |
| User Interface Types | Generation, Quorum | Type errors in the labeling interface against the node’s fields — the first 20 issues, each message capped at 500 characters, with a count of the rest |
| Dataset Items | Start | Whether the current dataset, filter, and item limit select anything, and whether the selected items carry the required fields |
The Match node has no checks at all.
Which one to run depends on what you want to know:
- Run Code Test to confirm your Python returns the right output before a run relies on it.
- Run User Interface to see and try the real labeling screen yourself, the way an expert will.
- Run LLM Quality Assurance to preview how the LLM reviewer judges an output before a run.
- Run Synthetic Generation Test to see what your model actually produces, and what it costs in tokens, before paying for a run.
The three lint checks read the node’s current settings instead of a case you write, but you or the agent still press Run. On the node each appears as its own card, marked with a Lint badge.
Running a check
Section titled “Running a check”Both the agent and the node’s own cards can run a check, and they act on the same stored cases.
Ask the agent, in the chat, to add check cases to a node or to run its checks. It can run every kind except one. On the node itself, each check kind is a card in the inspector. In a test-check card you add a case with +, give it a name and a JSON input, then Run or Delete it. An empty card reads “No checks yet”. Adding a case pre-fills its name and an empty {} input for you to edit. The Quality Requirements card has no case to add, so you run it directly.
The one action the agent cannot take is running a User Interface check. Running that check means completing the task yourself: the platform opens the real labeling screen, and a person fills it in and submits. The agent can set up the case, but only you can complete the screen. A User Interface check you open and leave unsubmitted expires after about an hour, and the run then shows as failed.
The states a check shows
Section titled “The states a check shows”A test-check card — Code Test, User Interface, LLM Quality Assurance, or Synthetic Generation Test — shows one of four states:
- Check not run means no run yet.
- Check running means a run is under way.
- Check passed means the last run succeeded.
- Check failed means the last run failed.
A lint card uses its own words and has one state more: Not started, Running, Completed, Completed with issues when the run found something, and Failed. The Dataset Items card also reports how many items it checked.
A finished run keeps its detail on the card. A passed run shows its Output, a failed run shows its Error, and either can show Logs.
The deploy gate
Section titled “The deploy gate”When you deploy, the platform sorts every issue into one of two severities: an error you must resolve, or a warning you can override. The built-in lints are the strict ones.
| Issue | Severity | Deploy past it? |
|---|---|---|
| A configuration error (empty code, a missing or badly formatted node name) | Error | No |
| Any built-in lint not run or still running — Quality Requirements, User Interface Types, Dataset Items | Error | No |
| A completed User Interface Types lint reporting an error-level finding | Error | No |
| Any check that failed | Error | No |
| A check case whose input no longer matches the node | Error | No. Fix or delete it |
| A test check not run or still running | Warning | Yes, with override |
| A node with no checks configured | Warning | Yes, with override |
So a missing test check is a warning you can override, while a built-in lint that has never finished blocks the deploy, and so does a failed check of any kind. A check case that no longer fits its node also blocks until you fix or delete it. For example, its input may name a field the node has since dropped.
What the Issues window lets you do depends on what it found:
- With Errors present, the window has no deploy control at all — only Fix all with agent, the per-row fix icons, and the close button. There is no way to deploy past an error.
- With Warnings only, the window adds a Deploy button, but you must first tick I want to deploy with unresolved warnings. Fix all with agent is there too.
- With No issues, no window appears. Deploy takes you straight to the Cost breakdown (forecast) window to confirm the spend, covered in Pricing and billing.
Every issue row also has a fix-with-agent icon button that hands the agent that one issue to resolve. The gate also holds outside the window: the server revalidates before it starts the run and refuses if any blocking error remains. One asymmetry — a run started through the public API skips the not-run and still-running lint errors, though configuration errors and failed checks still stop it.
When a passing check goes stale
Section titled “When a passing check goes stale”A passing check is a statement about the configuration it ran against. Change that configuration and the statement no longer holds, so the check reverts to not run and you rerun it. Each kind watches a different slice of the node. Synthetic Generation Test watches the fields, the instruction, and the Audience & Pricing card; User Interface Types watches the interface; Dataset Items watches the dataset, filter, and item limit the Start node selects. For the four older kinds:
- Code Test watches the code, the fields, and the environment variables.
- User Interface watches the labeling screen and the node’s fields.
- LLM Quality Assurance watches the quality criteria, the node’s fields, the instruction, and the review settings.
- Quality Requirements Lint watches the quality criteria, the node’s fields, and the instruction.
Editing a check’s own sample input resets it the same way. A green check therefore reflects the node as it stands now, not an earlier version of it.
What the self-check is not
Section titled “What the self-check is not”The self-check tells you the pipeline is built correctly. It does not assess label quality or replace the run.
- Test checks use sample values, not your data. Each runs on the input you enter into the case. The Dataset Items lint is the exception: it reads the items the Start node currently selects, to tell you the selection is empty or missing required values.
- It costs nothing. Running checks adds nothing to your bill. Billing starts only when a real run labels real items. See Pricing and billing.
- It does not judge label quality. Quality control decides whether a label is good during the run. See Quality control. The Quality Requirements Lint only critiques how your criteria are set up, and the LLM Quality Assurance check only exercises the review on one sample.
- A pass does not guarantee the run will succeed. At run time an item can still fail on its own because of a returned value that breaks the node’s contract, a timeout, or a value over the size cap. The Code node reference lists those run-time limits.
Related
Section titled “Related”- How the platform works — where the self-check sits in the build-and-deploy flow.
- Code node — the Code Test’s case contract and the node’s run-time limits.
- Quality control — how labels are judged during a run.
- Errors and how to fix them — the most common Issues and every check-card message, verbatim, each with its cause and fix.
- Get your first labeled dataset — the self-check inside a full build.